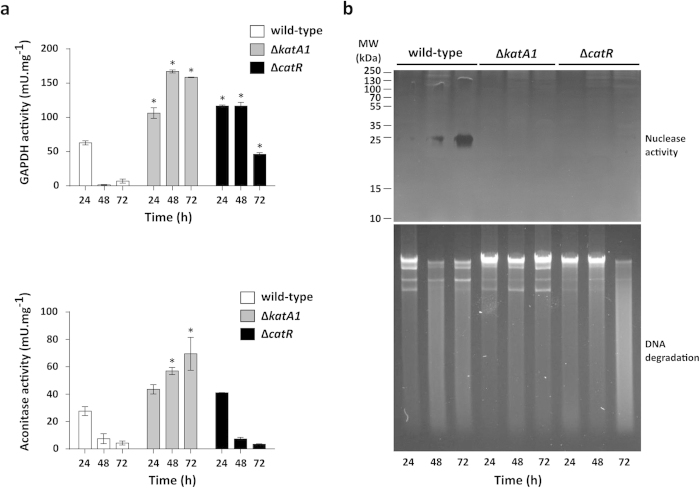
Figure 4. Assessment of primary metabolism enzyme activities and programmed cell death markers in S. natalensis wild-type, ΔkatA1 and ΔcatR strains.
(a) Determination of GAPDH (top panel) and aconitase (bottom panel) enzymatic activities in protein crude extracts. Results (average of triplicates and standard deviation) are representative of three independent experiments. Statistically significant differences between strains at each time point were assessed by one-way ANOVA followed by post hoc test (Tukey test; GraphPad Prism). * p < 0.01. (b) The upper panel depicts nuclease activity in protein crude extracts (20 μg of protein per lane); the SDS-PAGE performed with the protein extracts was used as loading control (Supplementary Fig. S3). The lower panel shows the integrity of total genomic DNA in a 0.8% (w/v) agarose gel (1 μg of total DNA per lane).

