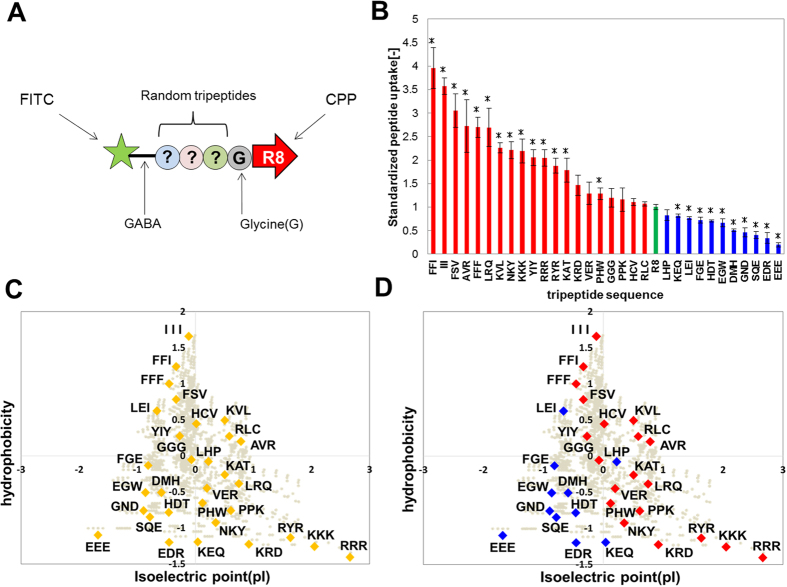
Figure 4. Modulation of released peptide uptake ability by adding tripeptide sequences to R8.
The uptake of released tripeptide conjugated R8 was measured with a multi-plate reader. (A) This figure is a schematic of the peptide motifs used in intracellular uptake measurement. (B) Uptake of tripeptide-conjugated R8 compared to that of R8 alone (green bar). Red bars represent tripeptides that showed enhanced cellular uptake ability, compared to the control. Blue bars represent tripeptides that showed decreased cellular uptake, compared to the control. On the y-axis is the standardized value of the result measured with the multi-plate reader. All measurement scores were normalized to the control (R8) as 1.0. (C) This figure is a chart of all the tripeptide sequences classified by hydrophobicity versus isoelectric point (pI). The values of these indices were normalized. Gray circles denote all tripeptides. (D) Color classification based on the results of (B). Means ± SD of three experiments are shown. *p < 0.05.

