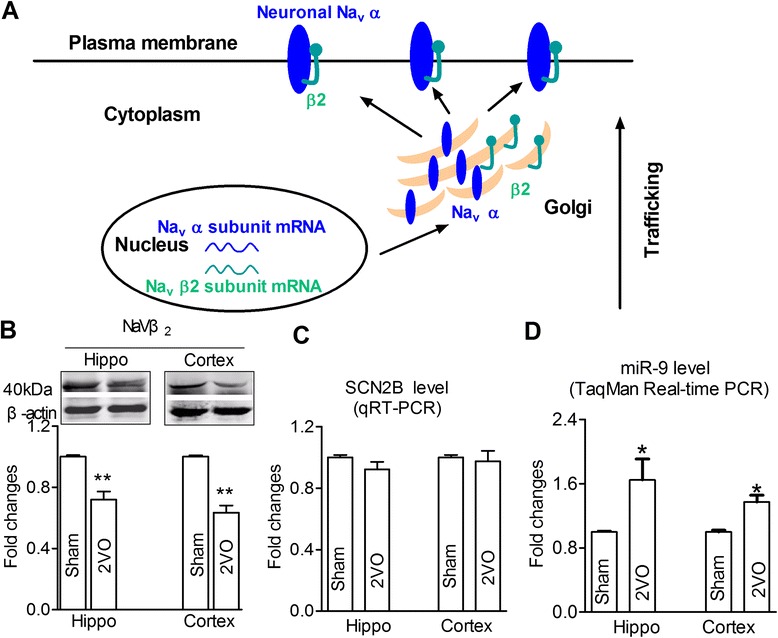
Fig. 2.

Navβ2 was decreased in hippocampi and cortices of rats after CBH. a, a model for Nav α-subunit trafficking after covalently binding to Navβ2 subunit. b, western-blot analysis of Navβ2 in sham and 2VO rats, upper: representative immunoblots of Navβ2; lower: the quantitative analysis data of the immunoblots. The optical density was evaluated for each band and values for 2VO rat tissue were normalized to sham group after correction for protein loading with β-actin. **P < 0.01 vs sham, mean ± s.e.m, n = 6. c, The relative quantification of Navβ2 mRNA (SCN2B) levels was detected by real-time PCR with normalized to β-actin, followed by further normalization to the values from sham brain tissues. P > 0.05 vs Sham, mean ± s.e.m, n = 3. d, miR-9 level detected by TaqMan real-time PCR in hippocampi and cortices from sham and 2VO rats after normalization to U6 levels. *P < 0.05 vs sham, mean ± s.e.m, n = 3
