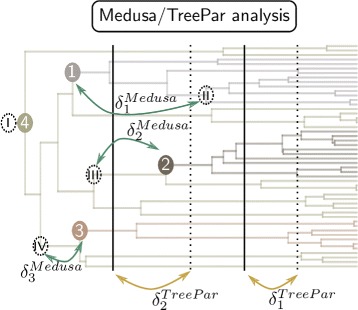
Fig. 2.

Exemple output of the analyzes. We run the Medusa and TreePar analysis, and group the pairs of simulated/estimated events by minimizing the sum of the distance separating the events in each pair . Vertical dotted lines: estimated mass extinction events by TreePar, dotted circles: estimated diversification rate shift by Medusa, by decreasing significance, other: as in Fig. 1. The first estimated shift is always at the root of the tree
