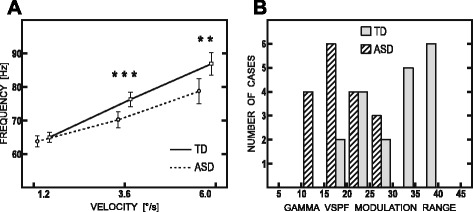
Fig. 4.

Velocity-related changes of HGO frequency in ASD and TD subjects. a GLM results for gamma VSPF. Solid line—TD; dashed line—ASD. Asterisks denote significant between-group differences: **p < 0.005; ***p < 0.001. b Frequency distribution of VSPF modulation range (i.e. difference in VSPF for the fast and slow stimulus velocities) in the TD (white bars) and ASD (striped bars) groups
