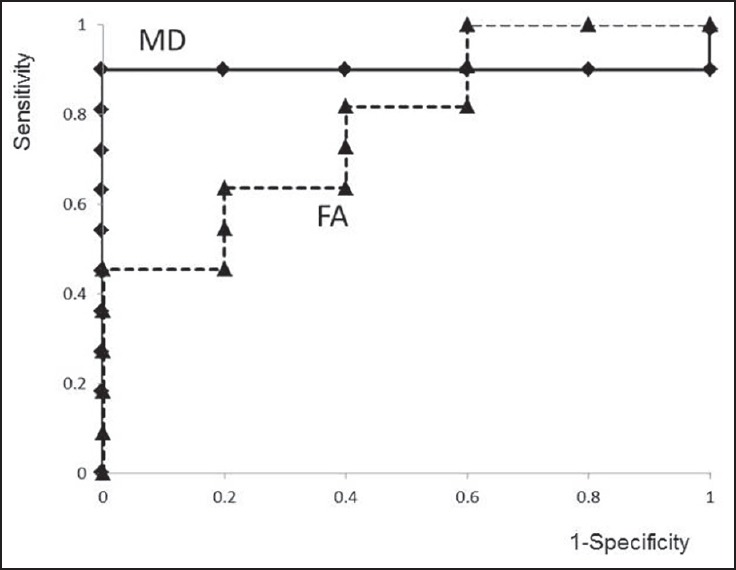
Figure 4.

Receiver operating characteristic curves of mean diffusivity (MD) and fractional anisotropy (FA). The areas under the curves of MD-z and FA-z are 0.91 and 0.78, respectively. The optimal cut-off value of MD-z is 3.2, with a sensitivity of 91%, and specificity of 100%. The predictive probability of a positive test is 100% (10 of 10), and the predictive probability of a negative test is 83% (5 of 6)
