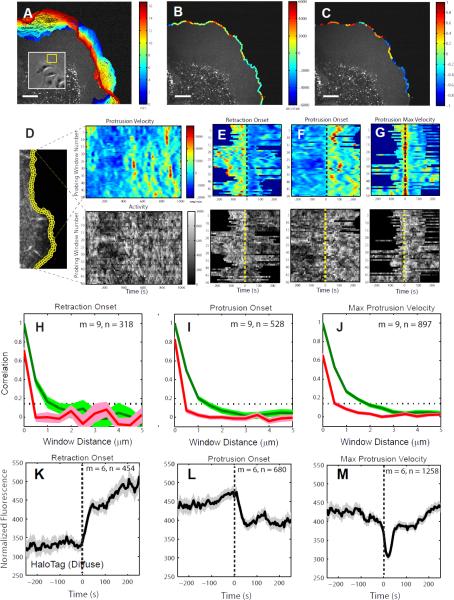
Figure 1. A local sampling and registration approach using intrinsic fluctuations at the leading edge of migrating PtK1 epithelial cells.
(A) Positions (blue, early; red, late time points) of the leading edge of a PtK1 cell stained with CellMask Orange membrane marker undergoing a wound healing response. Inset: Overview of epithelial cell sheet with protruding region highlighted by yellow box. (B) Protrusion (green to red colors) and retraction (green to blue colors) velocities tracked in edge sectors of 500 nm length. (C) Normalized times since protrusion (green to red colors) or retraction (green to blue colors) onset for each sector tracked in (B). A value 0 means the sector starts to protrude or retract. A value 1 or -1 means the sector terminates a protrusion or retraction segment, respectively. Scale bars: 10 μm. (D-G) Registration of spatially localized time series reporting molecular or cellular activities by alignment of motion events. (D) Left: Quantification of cell edge motion and molecular or cellular activities in 500 × 500 nm probing windows tracking the cell movement (see also Data File1:Movie S3). Right: Space-time map of instantaneous edge velocity (top) and activity (in this example, normalized fluorescence) (bottom); each row represents the velocity and activity time series, respectively, of one probing window. Registration of velocity map (top) and activity map (bottom) with respect to retraction onsets (t=0) (E), protrusion onsets (t=0) (F), and maximal protrusion velocity (t=0) (G). (H-J) Correlation of protrusion velocities between adjacent sampling windows; The red lines indicate Pearson's correlation coefficients between protrusion velocity time series acquired in sampling windows separated by the specified distances. The series are registered with respect to retraction onset (H), protrusion onset (I), and maximal protrusion velocity (J). The green lines indicate Pearson's correlation coefficients between sampling windows separated by the specified distances without considering time shifts in each case. The dotted lines indicate the 95% confidence level of the correlation values. For each condition the number n of time series sampled in m cells pooled from 4 independent experiments is indicated. (K-M) Normalized fluorescence intensity time series of HaloTag-TMR registered with respect to retraction onset, protrusion onset or maximal protrusion velocity. For each condition the number n of time series sampled in m cells pooled from 2 independent experiments is indicated. Solid lines indicate population averages. Shaded error bands about the population averages indicate 95% confidence intervals by bootstrap sampling.

