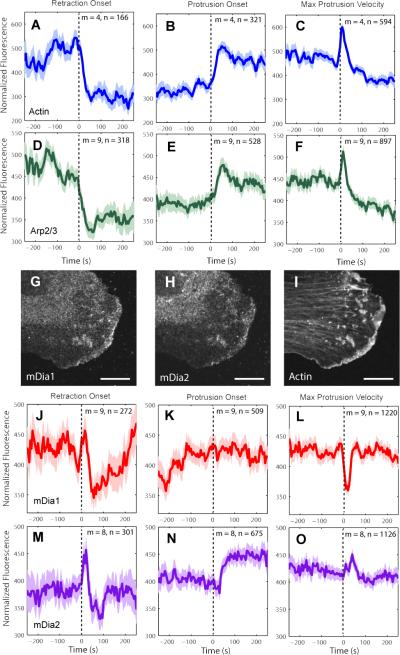
Figure 2. Recruitment of actin assembly factors to lamellipodium.
(A-F), (J-O) Normalized fluorescence intensity time series registered with respect to retraction onset, protrusion onset or maximal protrusion velocity. Time axis spans average duration of protrusion or retraction events (see Figure S6A and C). For each condition the number n of time series sampled in m cells pooled from multiple independent experiments (3 experiments for actin, 4 for Arp2/3, 4 for mDia1, and 4 for mDia2) is indicated. Solid lines indicate population averages. Shaded error bands about the population averages indicate 95% confidence intervals computed by bootstrap sampling. (G-I) Immuno-localization of formins mDia1 (G), mDia2 (H), and phalloidin-actin (I). Scale bars: 5 μm.

