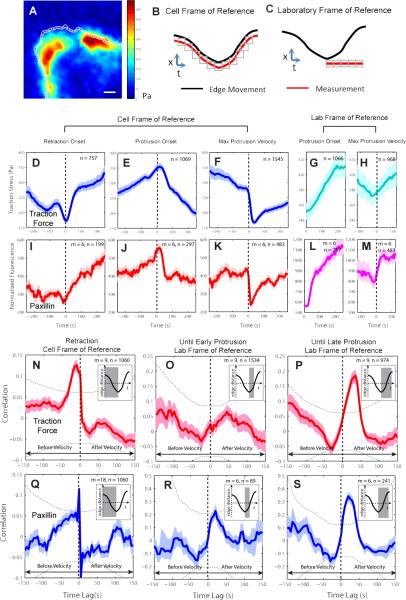
Figure 3. Traction force and adhesion dynamics in epithelial cell protrusion.
(A) Map of the magnitude of the traction force in a PtK1 cell with 1 × 1μm probing windows at the leading edge. Scale bar: 5 μm. (B) Definition of a cell frame of reference in which probing windows track the leading edge. (C) Definition of a laboratory frame of reference in which probing windows are placed at the sites of protrusion initiation and remain stationary to track activities associated with newly formed adhesions. (D–M) Time series of traction force (D–H) and normalized paxillin (adhesion marker) fluorescence intensity (I–M) in cell or laboratory frames of reference registered with respect to retraction onset, protrusion onset, or maximal protrusion velocity. (N–S) Pearson's cross-correlation of traction force and edge velocity (N–P) and of paxillin and edge velocity (Q–S) as a function of the time lag between the two variables using time series acquired during retraction phases in the cell frame of reference (N,Q), and time series acquired during early (from protrusion onset to 50 sec before maximal protrusion velocity) (O,R), and overall (from protrusion onset to 50 sec after maximal protrusion velocity) (P,S) protrusion phases in the laboratory frame of reference. For each condition the number n of time series sampled in m cells pooled from 3 independent experiments is indicated. Inset: The gray areas indicate the periods of the time series used for correlation analysis. Solid lines indicate population averages. Shaded error bands about the population averages indicate 95% confidence intervals computed by bootstrap sampling. Dotted lines (two arcs) indicate the significant correlation level with 95% confidence.

