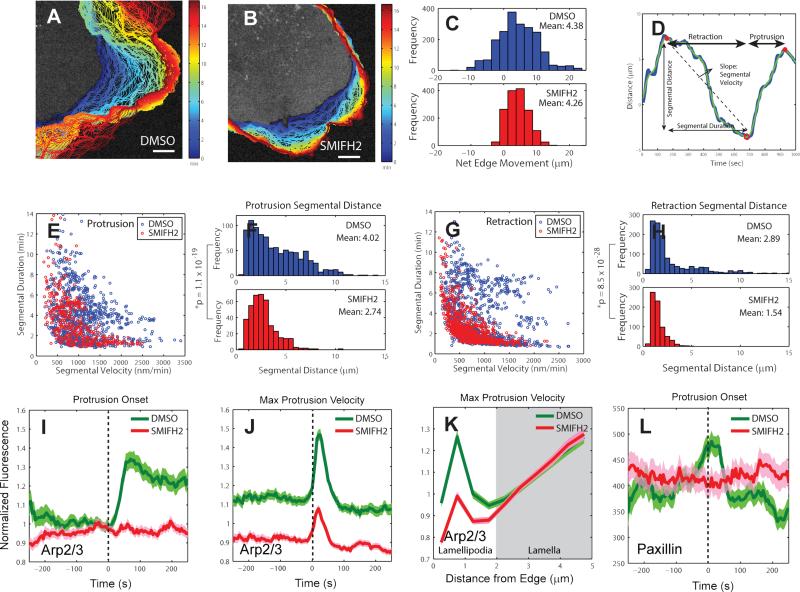
Figure 5. Effects of formin inhibition on protrusion length, Arp2/3 activation, and adhesion dynamics.
(A-B) Positions (blue, early; red, late time points) of leading edge of cells stained with CellMask Orange membrane marker and treated with DMSO (control) (A) and 20 μM SMIFH2 (formin inhibitor) (B). Scale bars: 5 μm. (C) Distribution of net edge movement in DMSO (n = 2,023 sectors from m = 9 cells) or SMIFH2 (n = 1498 sectors from m = 9 cells) treated cells, (D) Motion of a single 500nm-long edge sector over 16 minutes. Blue line: protrusion distance obtained by time-integration of protrusion velocity, Green line: spline-filtered protrusion distance, Red open circle (o): protrusion onset, Red solid circle (•): retraction onset. The time interval between a retraction onset and a protrusion onset is defined as a retraction segment. The time interval between a protrusion onset and a retraction onset is defined as a protrusion segment. (E) Velocity vs. duration of individual protrusion segments in DMSO- (n = 950 segments from m = 9 cells pooled from 3 independent experiments) and SMIFH2- (n = 399 segments from m = 9 cells pooled from 3 independent experiments) treated-cells. (F) Distribution of protrusion segmental distance in DMSO or SMIFH2-treated cells. n = 950 protrusion segments from m = 9 cells for DMSO and n = 399 protrusion segments from m = 9 cells for SMIFH2. The data were pooled from 3 independent experiments. P-value is calculated using one tailed K-S test. (G) Velocity vs. duration of individual retraction segments in DMSO (n = 1,180 segments from m = 9 cells) or SMIFH2 (n = 718 segments from m = 9 cells) treated cells. (H) Distribution of retraction segmental distance in DMSO or SMIFH2 treated-cells. n = 1,180 retraction segments from m = 9 cells for DMSO and n = 718 retraction segments from m = 9 cells for SMIFH2. The data were pooled from 3 independent experiments. P-value is calculated using one tailed K-S test. (I-J) Time series of Arp2/3 intensity in the lamellipodium, normalized to the Arp2/3 intensity in the region 1.5 – 2 μm from the cell edge, registered with respect to protrusion onset or maximal protrusion velocity in DMSO- or SMIFH2-treated-cells. (I) n = 556 time series sampled in m = 10 cells for DMSO and n = 602 time series sampled in m = 11 cells for SMIFH2, pooled from 3 independent experiments. (J) n = 1468 time series sampled in m = 10 cells for DMSO and n = 1467 time series sampled in m = 11 cells for SMIFH2, pooled from 3 independent experiments. (K) Spatial modulation of Arp2/3 fluorescence at time point of maximal protrusion velocity in DMSO- and SMIFH2-treated cells as a function of distance from the leading edge. (L) Normalized paxillin fluorescence intensity time series acquired in the cell frame of reference in DMSO- or SMIFH2-treated cells registered with respect to protrusion onset. n = 556 time series sampled in m = 8 cells for DMSO and n = 331 time series sampled in m = 11 cells for SMIFH2, pooled from 3 independent experiments. Solid lines indicate population averages. Shaded error bands about population averages indicate 95% confidence intervals computed by bootstrap sampling.

