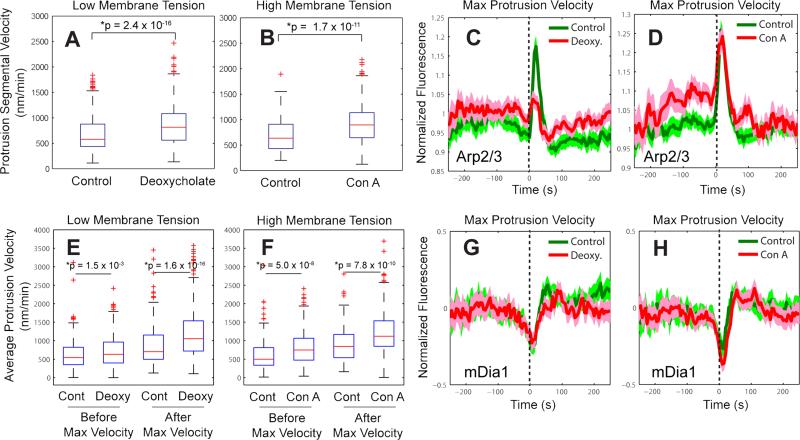
Figure 6. Mechanosensitivity of Arp2/3 dynamics during cell protrusion.
(A-B) Protrusion segmental velocity in control cells vs. cells treated with 400 μM deoxycholate to decrease membrane tension (A) (n = 1,950 time series sampled in m = 11 cells for control and n = 2,555 time series sampled in m = 12 cells for deoxycholate, pooled from 3 independent experiments) or cells treated with 1 μg/ml concanavalin A to increase membrane tension (B) (n = 1,796 time series sampled in m = 12 cells for control and n = 1,995 time series sampled in m = 10 cells for concanavalin A, pooled from 3 independent experiments). (C-D) Time series of Arp2/3 intensity in the lamellipodium, normalized to the Arp2/3 intensity in the region 1.5 – 2 μm from the cell edge registered with respect to maximal protrusion velocity in control vs. deoxycholate-treated cells (C) (n = 1,040 time series sampled in m = 6 cells for control and n = 1,448 time series sampled in m = 8 cells for deoxycholate, pooled from 2 independent experiments) or control vs. concanavalin A–treated cells (D) (n = 1,095 time series sampled in m = 8 cells for control and n = 1,054 time series sampled in m = 6 cells for concanavalin A, pooled from 2 independent experiments). (E) Average edge velocity between protrusion onset and maximal protrusion velocity vs. between maximal protrusion velocity and protrusion end in control vs. deoxycholate-treated cells. (F) Average edge velocity between protrusion onset and maximal protrusion velocity vs. between maximal protrusion velocity and protrusion end in control vs. concanavalin A–treated cells. (G-H) Normalized fluorescence intensity time series of mDia1 registered with respect to maximal protrusion velocity in control vs. deoxycholate- vs. concanavalin A–treated cells. (G) n = 1,182 time series sampled in m = 8 cells for control and n = 1,149 time series sampled in m = 7 cells for deoxycholate, pooled from 2 independent experiments. (H) n = 1,089 time series sampled in m = 8 cells for control and n = 1325 time series sampled in m = 8 cells for concanavalin A, pooled from 2 independent experiments. Solid lines indicate population averages. Shaded error bands about population averages indicate 95% confidence intervals computed by bootstrap sampling. P-values are calculated using one tailed K-S test.

