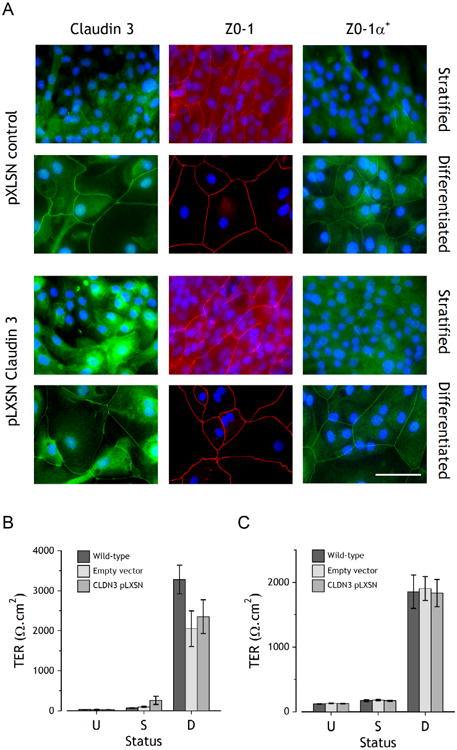
Figure 4. Analysis of NHU cultures following stable overexpression of claudin 3.

Claudin 3 overexpressing NHU cell transductants were generated as in Figure 3. A. Indirect immunofluorescent localisation of claudin 3, ZO-1 and ZO-1α+ in pLXSN control (empty vector) and pLXSN-claudin 3 overexpressing NHU cells, following stratification or differentiation. Scale bar = 50 μm. B and C. Barrier function of wild-type, empty-vector and claudin 3-pLXSN NHU cells was determined by measurement of transepithelial electrical resistance (TER) in undifferentiated (U), stratified (S) and differentiated (D) cultures. B shows a representative cell line, with n=3 replicates (mean ± SD), C shows averaged data from four independent cell lines (mean ± SEM). There were no statistically significant differences between wild-type or transduced cells and claudin 3 overexpressing cells of any status.
