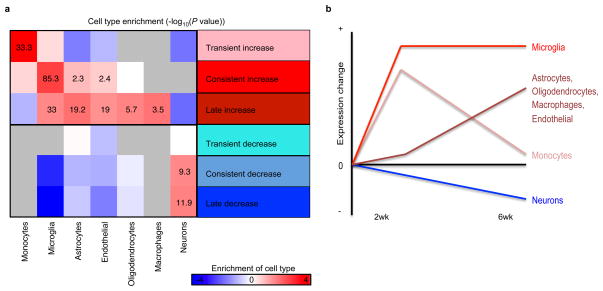
Extended Data Figure 9. Cell type composition.
a, For each class of gene expression change (x-axis), shown is the enrichment of cell-type-specific gene markers from published datasets48–50. The macrophage and monocyte categories are computed relative to microglia49,50. The enrichment is calculated relative to the genes that do not change in expression level in the CK-p25 mice. Cells in the heatmap are labeled based on the −log10(P value) (hypergeometric t-test). Cases where no genes overlapped are shown in grey. b, Summary of a, showing the inferred change in cell type composition across time.

