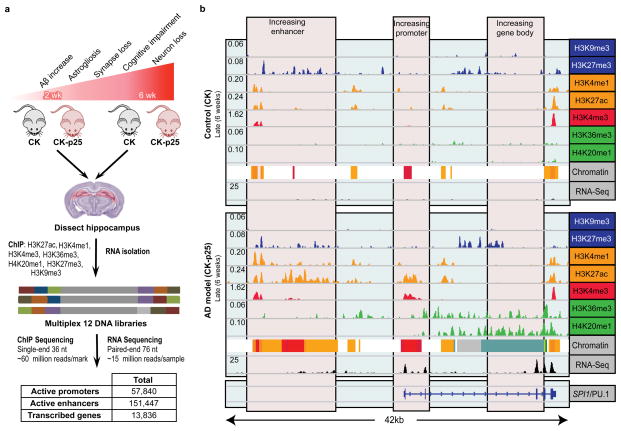
Extended Data Figure 1. Epigenomic and transcriptomic profiling of a mouse model of AD.
a, Experimental design and progression pathology in the CK-p25 mice. b, Gene expression and histone modification levels at the SPI1 locus at 6 weeks of inducible p25 overexpression. Profiled are histone marks associated with repression (blue); histone marks associated with enhancers (orange); histone marks associated with promoters (red); histone marks associated with gene bodies (green); RNA-seq (black).

