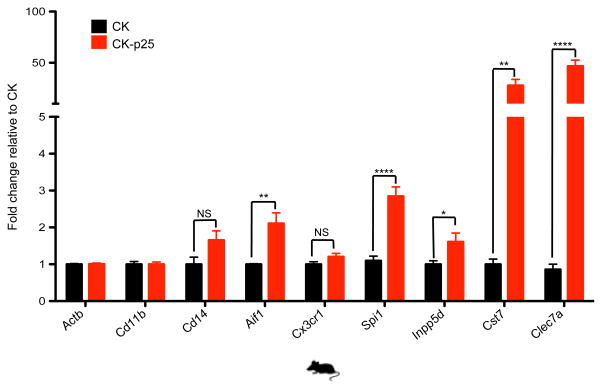
Extended Data Figure 2. Differential microglia-specific gene expression changes in the CK-p25 mice.
RT-qPCR of selected microglia markers and immune response genes shows upregulation of gene expression in FAC-sorted CD11b+ CD45Low microglia from 2 week induced CK-p25 mice (red bars) relative to respective controls (black bars). Actb (b-actin) was used as a negative control. Values were normalized to Cd11b expression (n=3, *P < 0.05, two-tailed t-test); NS, non-significant.

