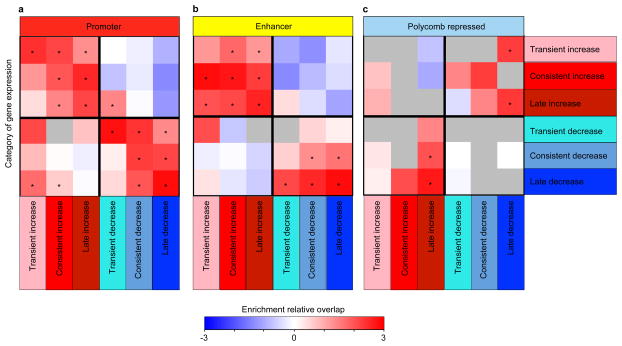
Extended Data Figure 5. Relationship between changes of gene expression and regulatory regions in CK-p25 mice.
For each class of gene expression change in the CK-p25 model (x axis), overlap with different histone modifications is shown (y axis) for a, H3K4me3 at promoters; b, H3K27ac at enhancers; c, H3K27me3 at Polycomb repressed regions. Histone modifications were mapped to the nearest transcription start site (Supplementary Table 3) to show the enrichment of the changing regulatory regions relative to those that are stable in CK-p25. The significance is calculated based on the hypergeometric P value of the overlap.

