. 2015 May 7;181(1):243–260. doi: 10.1039/c4fd00236a

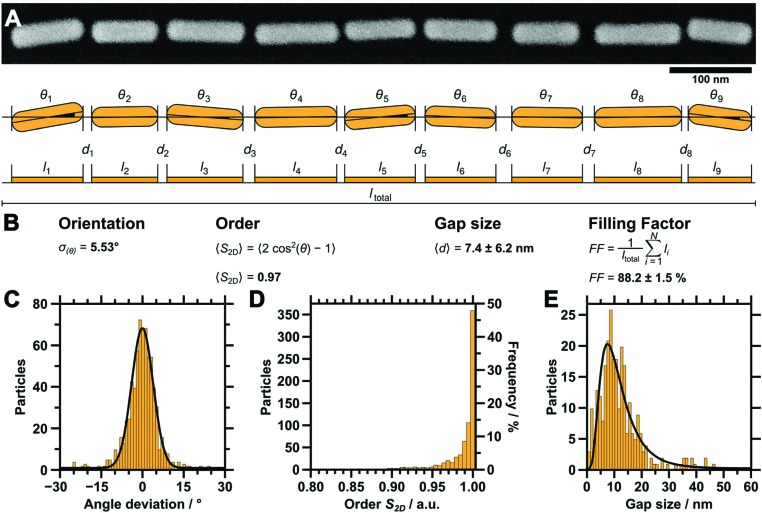
Fig. 5. (A) High magnification SEM image of an example single nanorod line (top) and a schematic depiction of the parameter evaluation (bottom). The angle deviations θ of each single particle, along with the interparticle gap distances d, were determined with a semi-automated procedure (IGOR Pro, Wavemetrics). (B) Summary of the equations used for analysis. (C) Distribution of the deviation from the mean angle of individual particles (bin size 1°, Gaussian fit, σ θ of 5.53°). (D) Distribution of the order of orientation as determined from the angle deviation (bin size 0.05, 〈S 2D〉 = 0.97). (E) Gap size distribution (bin size 1.117 nm, LogNormal fit, 〈d〉 = 7.4 ± 6.2 nm). The filling factor was determined to be 88.2 ± 1.5%.

Fig. 5