
Figure 5.
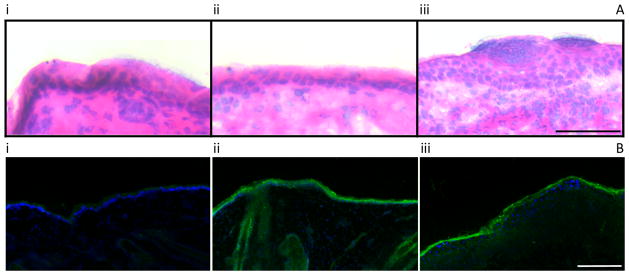
Panel A: Infiltration of the fetal skin in response to C. albicans exposure. (Control n=5; 1 d Candida n=5; 2 d Candida n=5). i: Control; ii: 1 d C. albicans exposure; and iii: 2 d C. albicans exposure. Scale bar represents 50 μm. Panel B: Relative to control, immunofluorescent staining for IL-8 (Alexa 488; green) is increased in the fetal dermis and epidermis after 1 d and 2 d C. albicans exposure. i: Control n=5 ii: 1 d Candida n=5; iii: 2 d Candida n=5. Cell nuclei are stained blue with DAPI. Scale bar represents 200 μm.