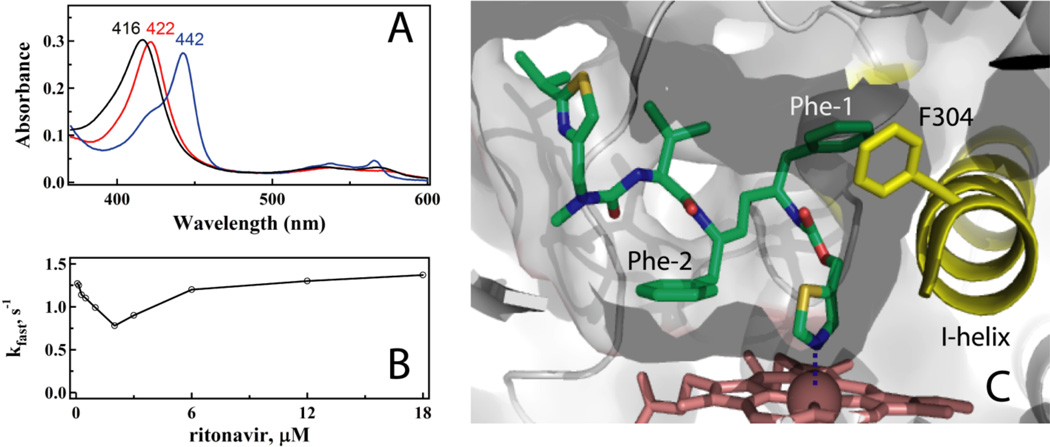
Figure 2.
A, Absorbance spectra of the ferric ligand-free and ritonavir-bound CYP3A4 (black and red, respectively) and its ferrous ritonavir-bound form (blue). Absorbance maxima for each species are indicated. B, Atypical (V-shaped) dependence of the rate constant for the ritonavir binding reaction on ligand concentration. C, Active site of ritonavir-bound CYP3A4.

