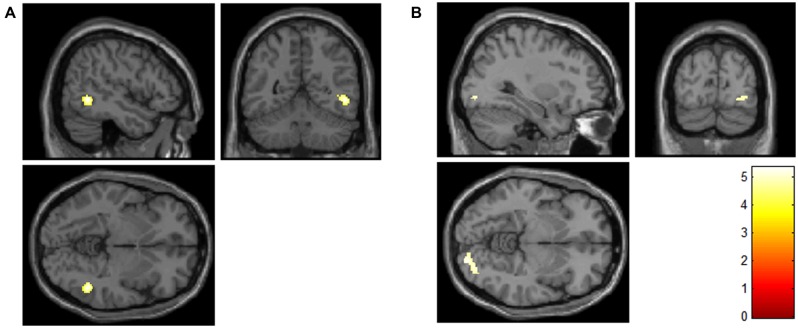
FIGURE 1.
Increased activity in the anorexia nervosa (AN) group compared to the control group in the right inferior and middle temporal gyri (A), and the right lingual gyrus (B) for participants’ own faces compared to neutral faces (contrast: AN > controls, own > neutral face; FWE-corrected for multiple comparisons at the voxel and cluster levels). The color scale indicates the t-value.

