
Figure 2.
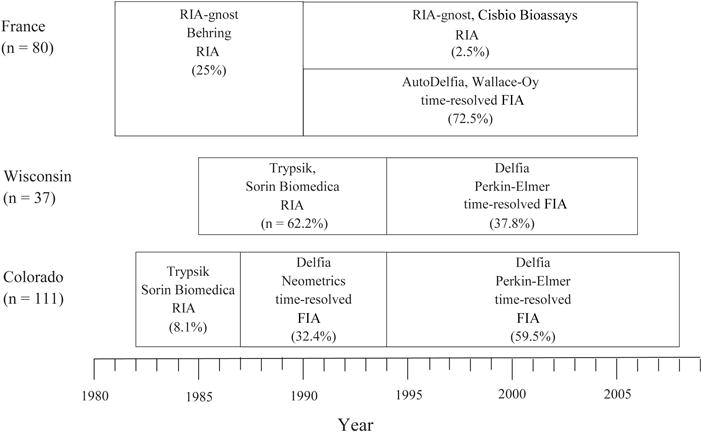
Changes to the IRT assay over time in each site. The x-axis represents year of measurement, and each box indicated the type of assay used, including the (1) assay name, (2) manufacturer, (3) type of assay, and (4) percent of subjects in each site that used that assay.