Figure 3.

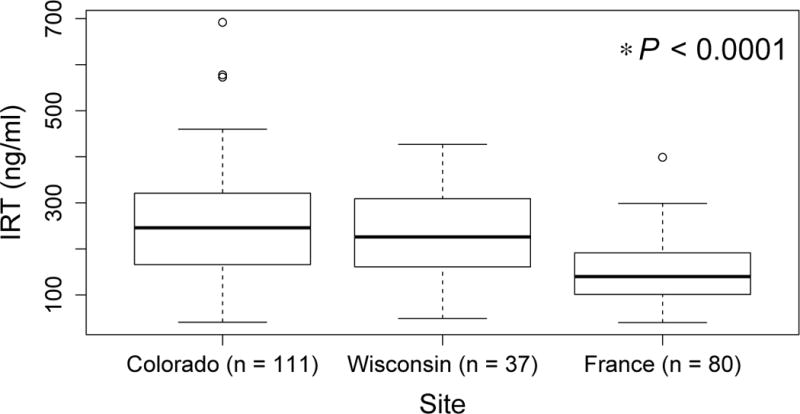
Distribution of NBS IRT in Colorado, Wisconsin and French samples. Box represents 25th, 50th (median), and 75th percentile. Whiskers represent 5th and 95th percentiles, and open circles represent values above the 95th percentile.

Distribution of NBS IRT in Colorado, Wisconsin and French samples. Box represents 25th, 50th (median), and 75th percentile. Whiskers represent 5th and 95th percentiles, and open circles represent values above the 95th percentile.