
Figure 4.
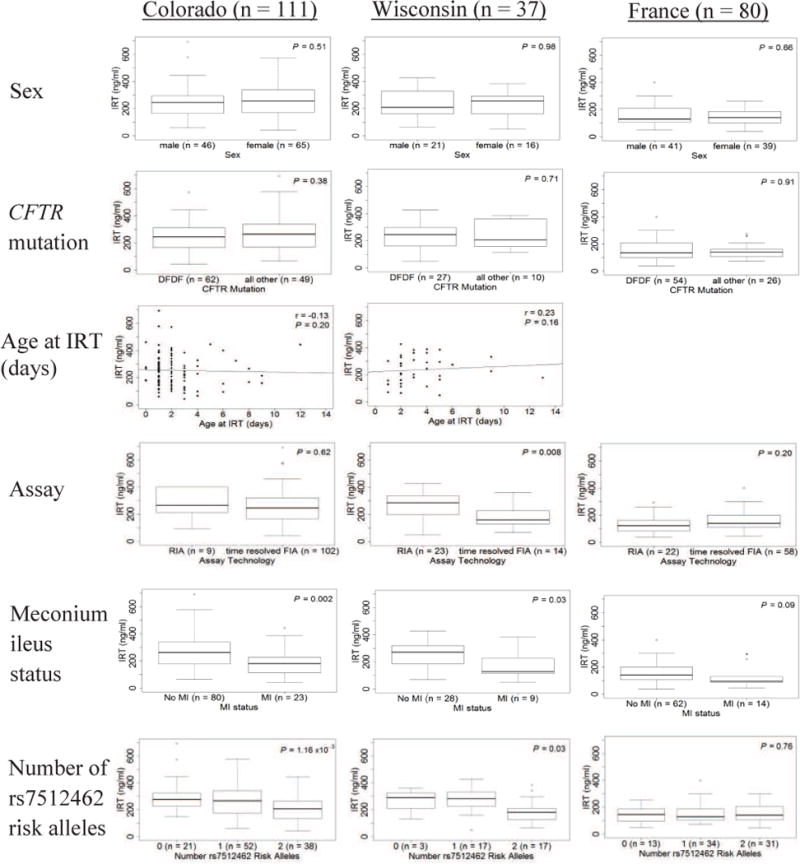
Distribution of NBS IRT is compared, within each site, by the following variables of interest: Sex (row 1): males versus female. CFTR mutation (row 2): Subjects are classified as delF508 homozygotes (DFDF) versus all others. Age at IRT (row 3): Correlation of age at IRT with IRT value (Colorado and Wisconsin only; In France, IRT is measured at 3 days of age). Assay (row 4): Categorized by the technology used to measure IRT, either radio-immunoassay (RIA), or a time-resolved fluorometric assay (FIA). Meconium ileus status (row 5): subjects with meconium ileus (MI) versus those without MI. Total n may be reduced as some subjects are missing MI status. Number of rs7512462 risk alleles (row 6): 0, 1, or 2 risk alleles. P-values for sex, assay, MI status and CFTR determined using Kruskal-Wallis tests. P-value for rs7512462 determined using linear regression. Age at IRT correlation determined using Spearman’s correlation. Box represents 25th, 50th (median), and 75th percentile. Whiskers represent 5th and 95th percentiles, and open circles represent values above the 95th percentile.