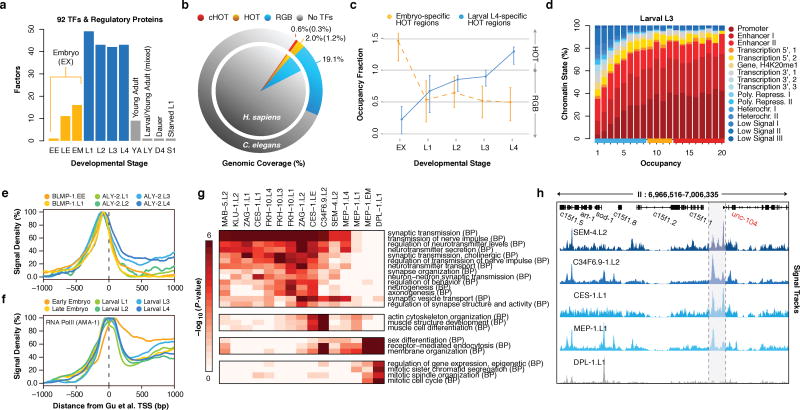
Figure 1.
Large-scale regulatory analysis of the C. elegans genome. (a) Factors assayed per developmental stage (or treatment) in 241 quality-filtered ChIP-seq experiments. Stages and treatments are abbreviated as Early Embryo (EE), Late Embryo (LE), Embryo Mixed (EM; EE and LE), larval L1 (L1), larval L2 (L2), larval L3 (L3), larval L4 (L4), Young Adult (YA), mixed Larval and Young Adults (LY), Day 4 Adult (D4), and Starved L1 (S1). Embryonic datasets were combined into a compiled embryonic stage (EX). Analyses in this report focus on embryonic (yellow) and larval (blue) experiments (NA=187). (b) Genomic coverage (percent of genomic bases) of regulatory binding (excluding RNA polymerases) in 181 C. elegans (outer circle) and 339 H. sapiens (inner circle) ChIP-seq experiments. Genomic coverage of cHOT, HOT, and other regulatory binding (RGB) regions are highlighted in red, yellow, and blue, respectively. cXOT and XOT percentages are shown in parenthesis. cHOT, HOT and RGB region coverage in the human genome are 0.17%, 1.4%, and 6.1%, respectively7. (c) Cutoff-normalized, occupancy levels in 126 embryo-specific (yellow) and 91 larval L4-specific (blue) HOT regions. Error bars indicate the 25th and 75th percentiles. (d) Chromatin state14 distribution of L3 larvae binding regions by occupancy. RGB, HOT, and XOT region occupancy levels are indicated along the x-axis as blue, yellow, and red bars, respectively. (e, f) Signal densities near enzymatically-derived TSSs30 for BLMP-1 and ALY-2, and RNA Pol II. (g) Functional (GO term) enrichment for gene targets of binding31. A subset of biological process (BP) terms (levels ≥ 4) are shown for factors enriched (BH-corrected, P < 0.01) in synaptic transmission; Early MEP-1 and DPL-1 data sets are included for comparison. (h) Example signal tracks near the UNC-104 locus.

