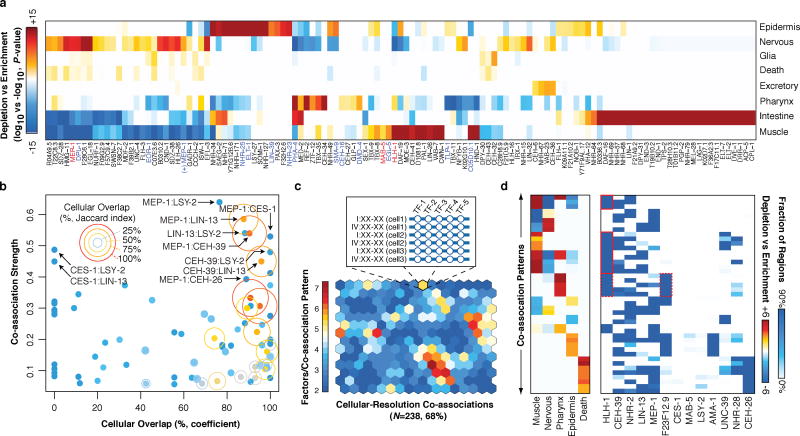
Figure 4.
Cell-type and lineage resolution of regulator activity and TF co-associations. (a) Tissue enrichment (−log10, P-value) and depletion (log10, P-value) scores for the expressing population of each gene are shown (Fisher’s exact, Bonferroni-corrected). Only genes with significant enrichments (or depletions) are shown. (b) Co-association strength (Fig. 2a) versus cellular overlap coefficient for 13 focus factors. The Jaccard index for the cellular overlap is indicated for each gene pair by ring size and color. (c) Cellular-resolution regulatory binding SOM. Cellular-resolution binding modules were generated by annotating in each cell, the binding of focus factors expressed in the cell. Cellular-resolution binding modules (inset) were clustered into a SOM with 268 learned co-association patterns, 161 (68%) of which were discovered in the data. The SOM is colored by the number of factors in the learned co-association patterns. (d) Tissue classes and co-association signatures are shown for 43 co-association patterns with significant enrichments. Tissue enrichments of interest are highlighted red.

