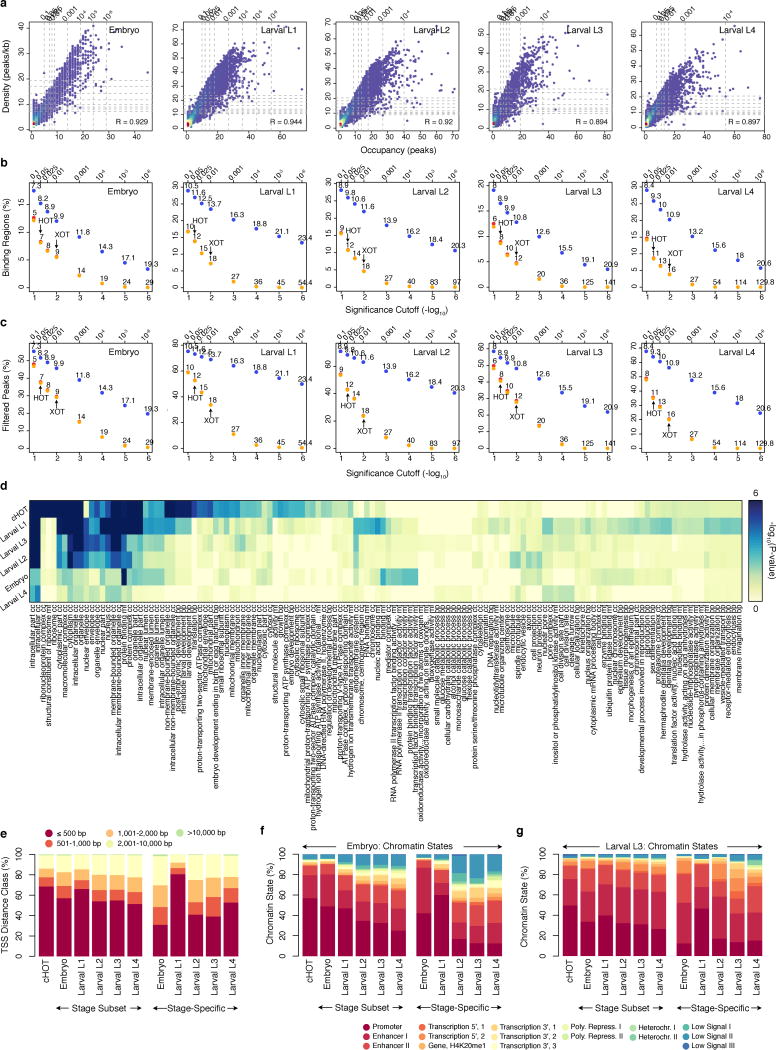
Extended Data Figure 2.
Stage-dependent determination and analysis of HOT and XOT regions. (a) Correlations in occupancy (number of binding sites, x-axis) and density (number of binding sites per kb, y-axis) in embryo and larval L1-L4 binding regions. Quantiles for occupancy and density derived from binding site simulations are indicated on each axis. The fraction of binding regions (b) and the fraction of binding sites in regions (c) exceeding the significance cutoffs (quantiles from simulations) is indicated for both occupancy (yellow) and density (blue). Fractions exceeding cutoffs for both metrics are shown in red. Specific occupancy and density cutoffs for each significance level are indicated above each point. HOT (5% significance) and XOT (1% significance) regions exceed the specific occupancy thresholds indicated with arrows. (d) GO enrichment analysis of constitutive HOT (cHOT), embryo, and larval L1-L4 HOT regions. For each stage, the non-cHOT stage-derived HOT regions were analyzed. GO enrichments in stage-specific HOT regions are available in Supplementary Table 3. (e) The distribution of HOT region distances from annotated TSS in the C. elegans genome (ws220) is indicated for cHOT regions, non-constitutive HOT regions (non-cHOT), and stage-specific HOT regions. With the exception of larval L1-specific HOT regions, stage-specific HOT regions tend to be more distal. The overlap of HOT regions with embryonic (f) and larval L3 (g) chromatin states14 is indicated for cHOT, stage-derived HOT regions, and stage-specific HOT regions. With the exception of larval L1-specific HOT regions, cHOT regions show stronger promoter-associated chromatin states than non-constitutive HOT regions.

