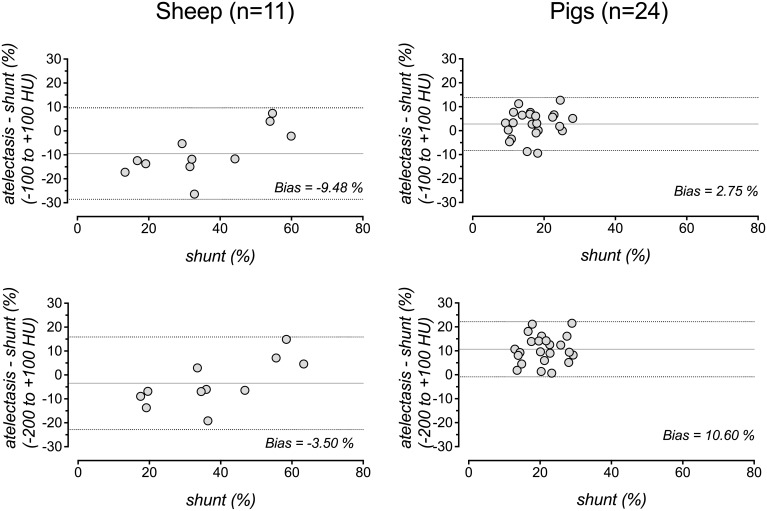
Fig 3. Agreement of shunt and atelectasis.
Bland-Altman plots for analysis of the agreement of intrapulmonary (Berggren’s) shunt and atelectasis, when the latter was quantified by analysis of whole-lung CT and expressed as percentage of the total lung mass for sheep (left) and pigs (right) using an atelectasis definition of -100 to +100 HU (top) or an extended range of -200 to +100 HU (bottom). Shunt is plotted on the x-axis because it is considered the gold standard. The difference plotted on the y-axis was calculated by subtraction of shunt from atelectasis. Solid line: mean difference (bias), dashed lines: 95% limits of agreement (mean difference ± 1.96 SD). Blood gases were obtained after short-term ventilation with pure oxygen for five minutes.

