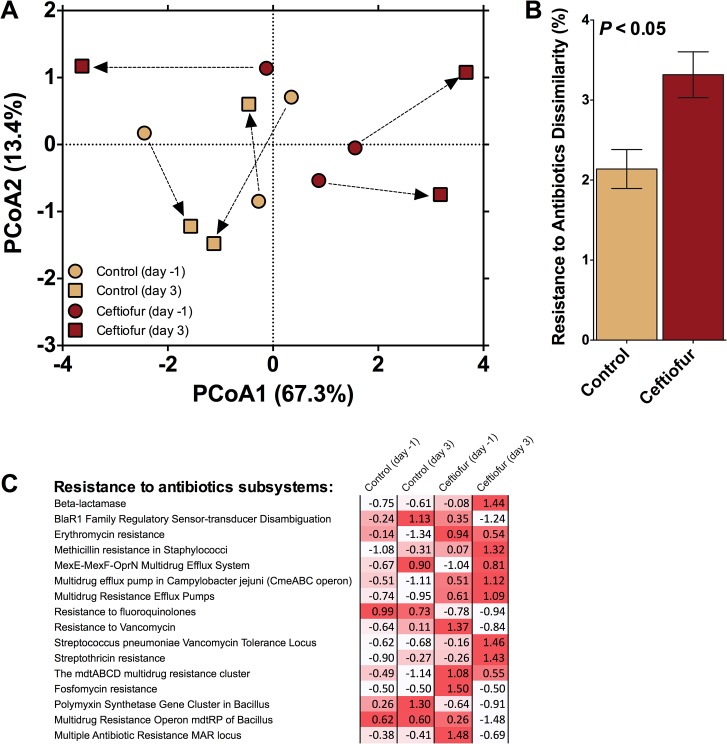
Fig 3. Results examining community composition.
A) Principal components analysis illustrating Bray-Curtis distance between initial fecal communities and those after 3 days of either exposure or no exposure to the antibiotic ceftiofur. Arrows indicate the change in communities associated with individual cows. B) Dissimilarity after 3 days between the fecal derived communities of control and ceftiofur treated cows. C) Change in the relative abundance of taxa across treatments. Note that the relative abundance of Class Bacteroidia and Actinobacteria tended to increase and decrease, respectively, after 3 days of exposure ceftiofur.

