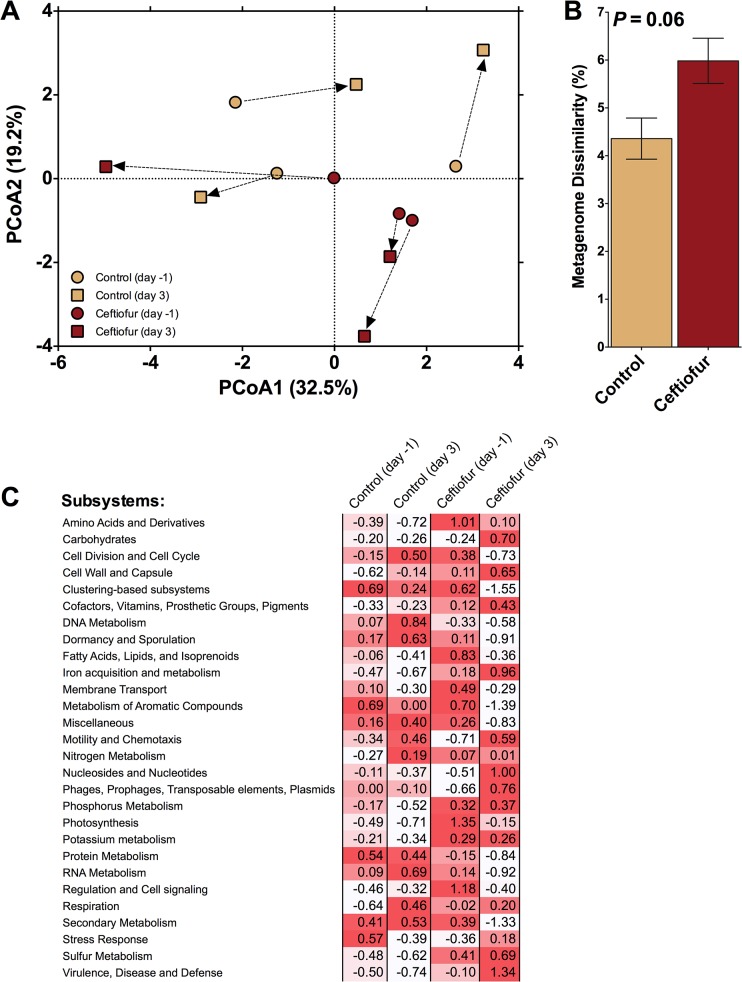
Fig 4. Comparison of metagenomes.
A) Principal component analysis illustrating Bray-Curtis distance between initial metagenomes and those after 3 days of either exposure or no exposure to the antibiotic ceftiofur. Arrows indicate the change in communities associated with individual cows. B) Dissimilarity after 3 days between the fecal derived metagenomes of control and ceftiofur treated cows. C) Standard scores (i.e. z-scores) compared across treatments within a given subsystem. Note: Red intensity of z-scores indicates relative increase from the mean associated with that subsystem.

