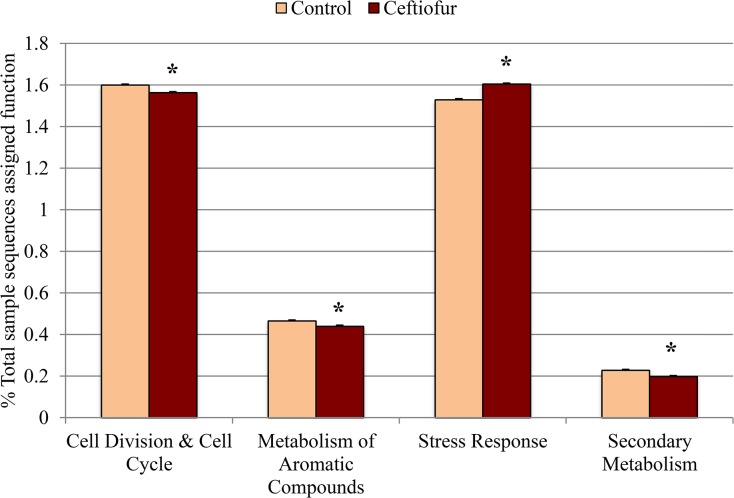
Fig 7. Abundance of “cell division and cell cycle”, “metabolism of aromatic compounds”, “stress response”, and “secondary metabolism” sequences in fecal samples collected from control (n = 3) and ceftiofur crystalline free acid treated (n = 3) cows on day 3 post-treatment.
Day 0 (pre-treatment) samples were used as a covariate. Values are expressed as a percentage of the total sample sequences assigned function. The symbol * indicates significant differences (P ≤ 0.10).

