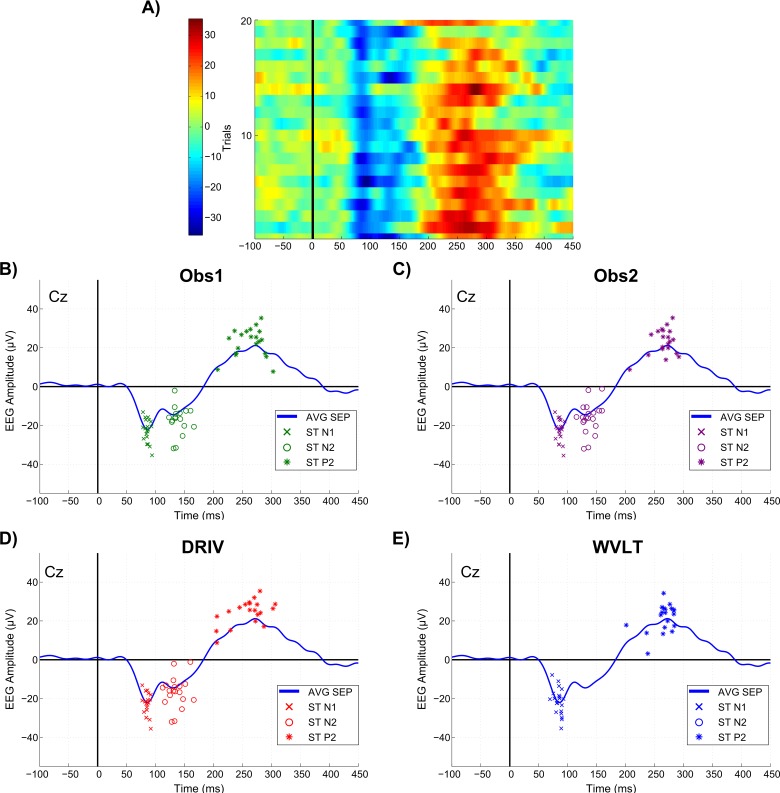
Fig 1. Comparison of manual and automated ERP feature detection/estimation methods.
A) Trial-by-trial image of ERP responses of a single subject elicited with the highest stimulation intensity (20 trials). B-E) Performance of OBS1, OBS2, DRIV and WVLT methods, respectively, on the detection/estimation of single-trial ERP features of a single subject elicited with the highest stimulation intensity. Crosses, circles and asterisks represent single-trial N1, N2 and P2 features, respectively, while the blue trace is the average of 20 trials. Note that WVLT algorithm did not detect the N2 peak in E).

