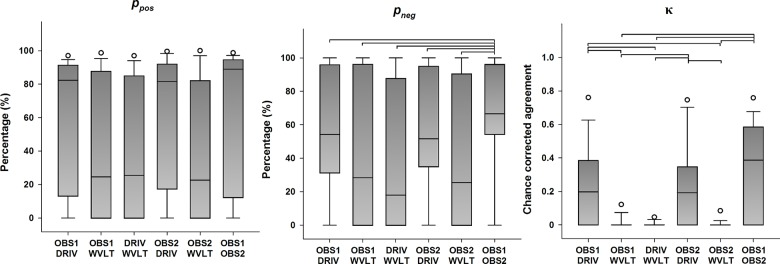
Fig 3. Categorical agreement in the detection of the N2 peak (primary outcomes).

The boundaries of the boxes indicate the 25th and 75th percentiles, the line within the box marks the median, the whiskers indicate the 10th and 90th percentiles and the circles above and below represent outliers (n = 16 for each index). Horizontal lines on top of the bars represent statistically significant post hoc differences between pairings (Student-Newman-Keuls, p < 0.05). p pos: positive percent agreement, p neg: negative percent agreement, κ: Cohen’s kappa.
