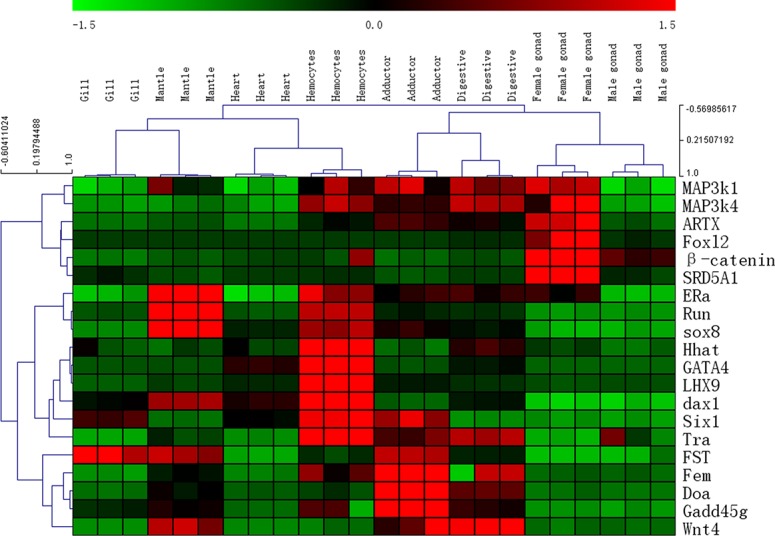
Fig 6. Heat map of sex determination/differentiation genes expressed at different adult tissues of C.hongkongensis.

Genes showing similar expression profiles on all samples (columns) were clustered together. Color represents the normalized expression after variance-stabilizing transformation. Expression levels are depicted with a color scale, in which shades of red represent higher expression and shades of green represent lower expression.
