
Figure 1.
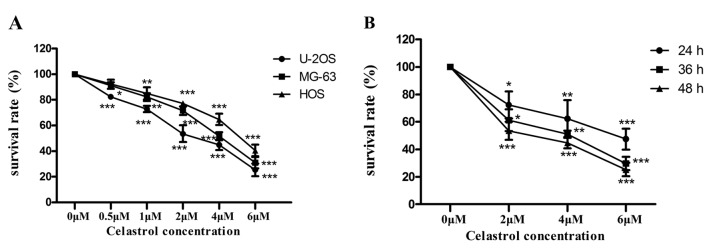
Analysis of cell viability. (A) Effect of celastrol on the viability of MG-63, U-2OS and HOS cells. Cells were treated with celastrol at different concentrations for 48 h. (B) Dose- and time-effect of celastrol on the viability of U-2OS cells. Cells were treated with celastrol at different concentrations for 24, 36 and 48 h. Cell viability was then determined and expressed as means ± SD. Significant differences from control (0 µM) are indicated by *p<0.05, **p<0.01, ***p<0.001.