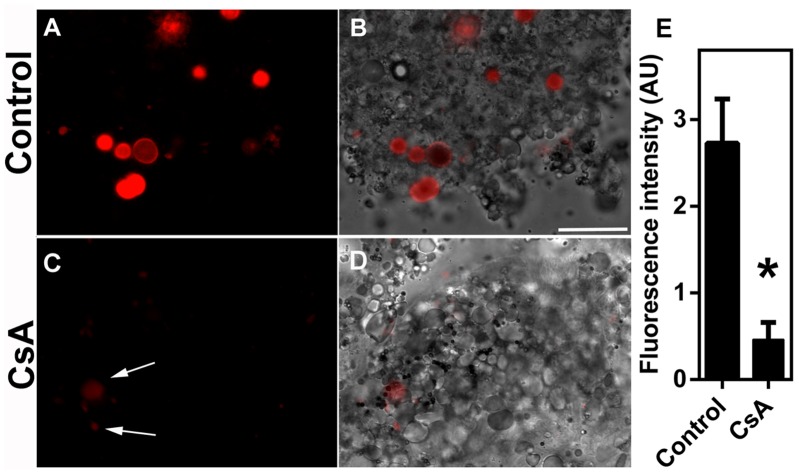
Fig 1. Uptake of Rhodamine 123 by midgut digest cells.
Digest cells from fully engorged adult females were obtained as described in the Methods. Digest cells were incubated in the presence of 0.5 μM Rhodamine 123 for 4 h. (A-B) Control; (C-D) cells preincubated with 10 μM CsA. Panels are fluorescence images (A and C) or differential interference contrast (DIC) merged with fluorescence (B and D). Digestive vesicles labeled are indicated in the figure by white arrows. Scale bar is 40 μm. Fluorescence intensity was measured in images from two independent experiments (E). Data shown are mean ± SEM (n = 12). * means p < 0.05 (Student’s t test).

