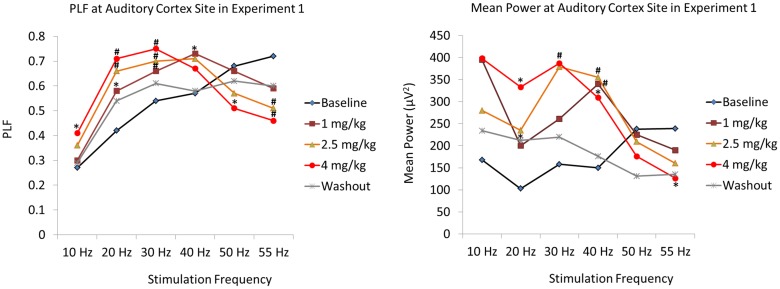
Fig 3. Experiment 1, Dose Response Study.
Graphs showing the mean PLF and MP values at each acute dose of PCP as a function of frequency of stimulation at the auditory cortex electrode. Asterisks indicate differences from baseline values (* p≤.05, # p≤.01). PCP caused a dose-dependent increase of PLF at low frequencies of stimulation (10, 20, 30 and 40 Hz), and suppressed PLF at high frequencies (50 and 55 Hz.)

