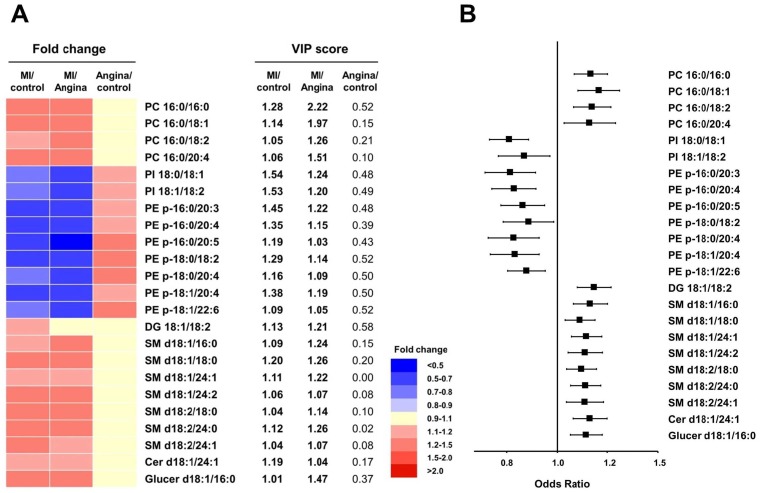
Fig 3. Significantly altered lipid metabolite in patients with MI.
Heat map showing the fold changes in and VIP scores of altered metabolites in patients with MI compared with control subjects and patients with angina (A) and the risk of MI (B). The values are ORs (95% CIs) increment for MI from the logistic regression. All models are adjusted for age, sex, BMI, LDL cholesterol, and fasting glucose.

