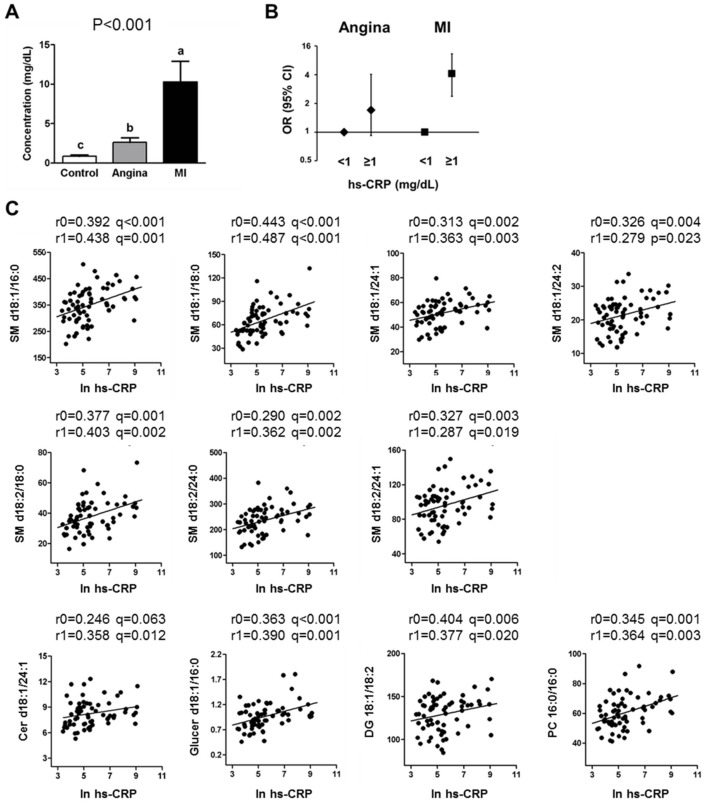
Fig 4. Association of specific metabolites and the acute inflammatory response.
(A) Serum hs-CRP concentration of the controls and patients with CAD (A) as tested by a one-way ANOVA with the Bonferroni post-hoc test. Groups with different superscript letters were significantly different (P < 0.05). Risk of CAD according to the hs-CRP concentration (B). The values are ORs (95% CIs) from the logistic regression. All models are adjusted for age, sex, BMI, LDL cholesterol, and fasting glucose. Significant associations between specific metabolites of sphingolipid metabolism and acute inflammation markers (C). Pearson’s (r0) and partial correlation (r1) coefficients. r0: unadjusted; r1: adjusted for age, sex, BMI, LDL cholesterol, and fasting glucose.

