
Fig 1. Spectra characteristics of rHDL and rHDL/res.
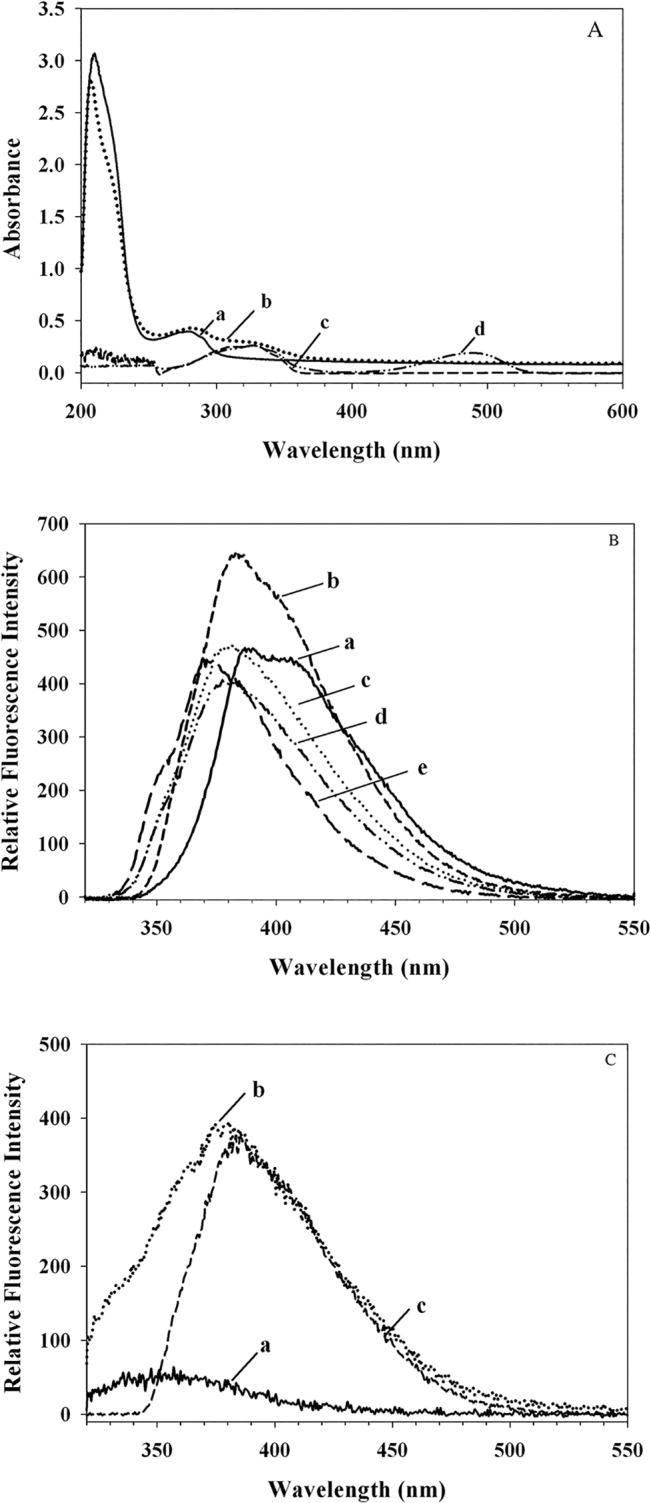
(A) The absorbance spectra of pooled fractions of rHDL (a), rHDL/res (b), resveratrol in DMSO (c) and res/NBD in DMSO (d) were recorded. (B) Fluorescence emission spectra of resveratrol were recorded in: water (a), DMSO (b), 95% ethanol (c), isopropanol (d), and ethyl acetate (e) with dielectric constants of 80.4, 33.0, 24.3, 7.5 and 6.0, respectively, following excitation at 310 nm. (C). Fluorescence emission spectra of rHDL (a) and rHDL/res (b) were recorded with 10 μg protein in PBS. For comparison, emission spectrum of resveratrol in DMSO is shown (c).