
Fig 3. Characterization of rHDL and rHDL/res particles.
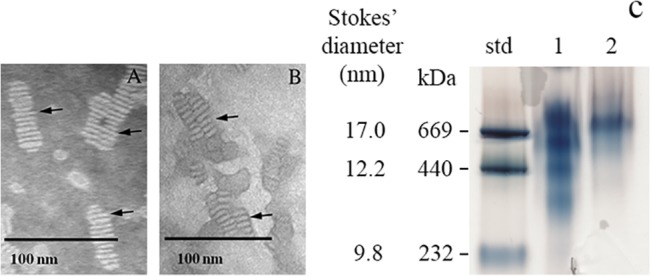
A & B. Transmission electron microscopy. Negative staining of rHDL (A) and rHDL/res (B) was carried with 10 μg protein. The bar represents 20 nm. Arrows draw attention to discoidal particles. C. Non-denaturing PAGE. rHDL and rHDL/res were electrophoresed on 4–20% acrylamide gradient gel. The far left lane bears the high molecular mass standards; the molecular mass and their corresponding Stokes’ diameters are indicated; lane 1) rHDL, and lane 2) rHDL/res. Arrows draw attention to particle heterogeneity in lane 1.