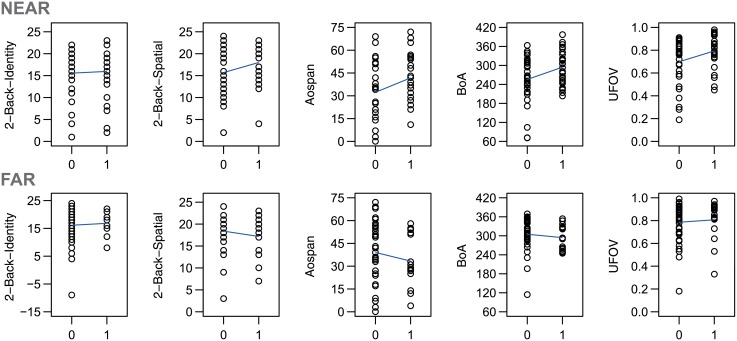
Fig 3. Scatterplots for Study 1.
Scatter plots of the relationships between inattentional blindness (0 = miss, 1 = notice) and the working memory and attention breadth measures in Study 1. The plots were prepared separately for the Near and the Far condition. The y-axes depict the test scores for each measure as described in the method section. Each circle represents a single participant. The blue lines depict the linear regression lines for each relationship.

