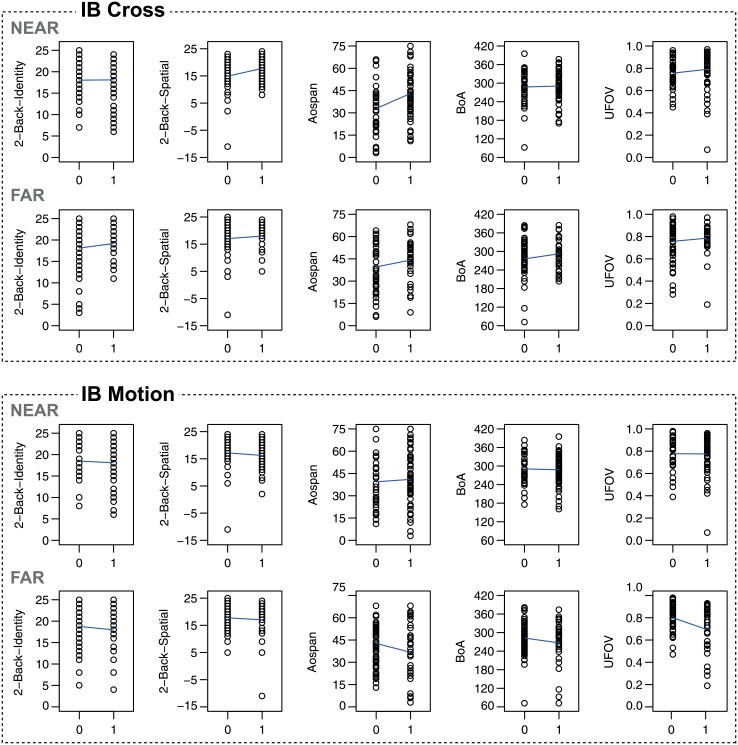
Fig 4. Scatterplots for Study 2.
Scatter plots of the relationships between inattentional blindness (0 = miss, 1 = notice) and the working memory and attention breadth measures in Study 2. The plots were prepared separately for IB Cross and IB Motion and for the Near and the Far condition. The y-axes depict the test scores for each measure as described in the method section. Each circle represents a single participant. The blue lines depict the linear regression lines for each relationship.

