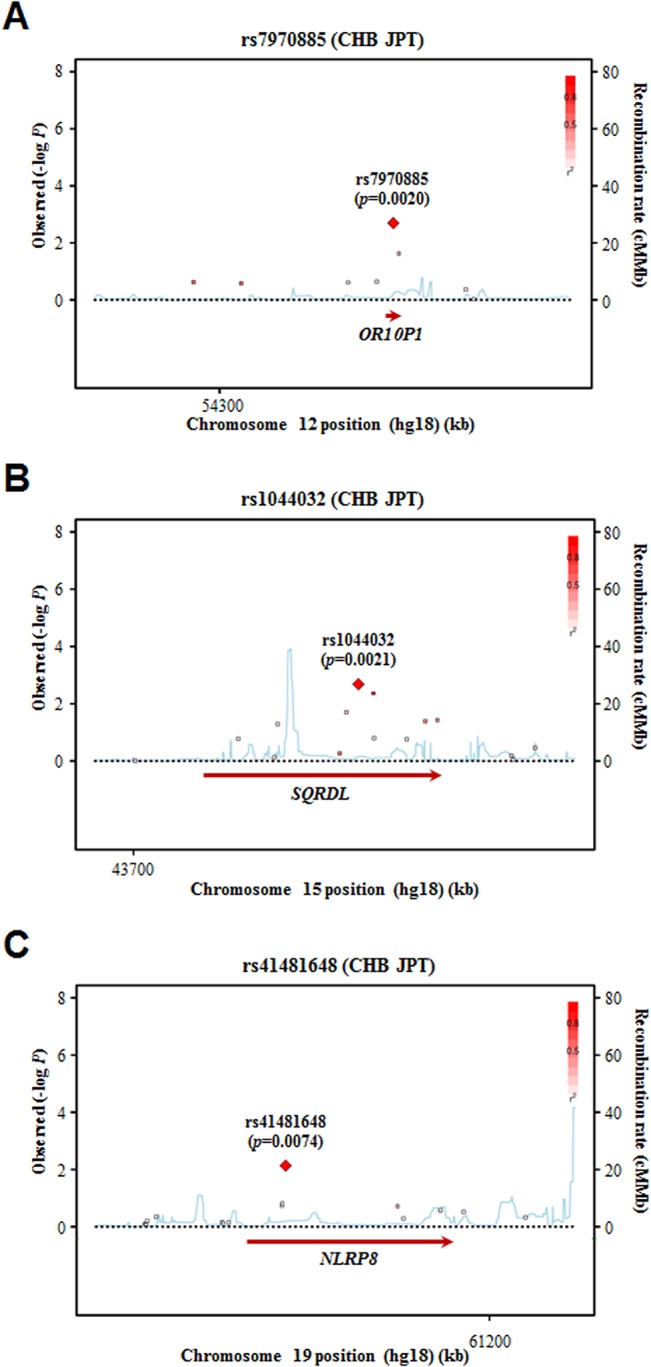
Fig 2. Plots of the association results of SNPs in the four osteoporosis-associated genes in the Korean postmenopausal women of the KARE cohort.

The regional association plots of the OR10P1 (A), SQRDL gene (B), and NLRP8 (C) were generated using the SNAP database (http://www.broadinstitute.org/mpg/snap/). The statistical significance (–log10 p-value) of the analyzed SNPs is plotted. The red diamond with a SNP number and p-value represents the SNP most strongly associated with osteoporosis, and its correlated SNPs are shown in the indicated colors in accordance with the levels of linkage disequilibrium (LD) (r 2). The recombination rate estimated from the HapMap CHB and JPT population data is shown by a blue line. The position (Mb) of each gene on human chromosomes (NCBI build 36) is shown at the bottom.
