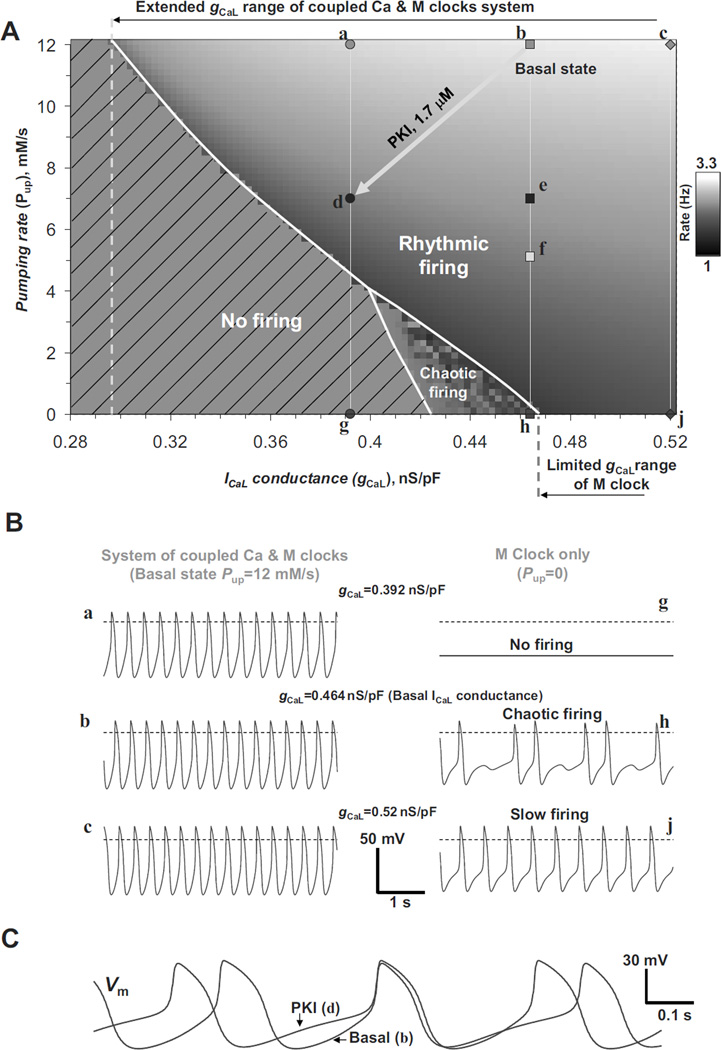
Figure 11.
A: A parametric system analysis (“population-based” modeling) using the ML model (10) with simultaneous variations in ICaL conductance and SR Ca2+ pumping rate. The image shows the result of 97(x) × 61 (y) = 5917 simulations (each pixel = 0.0025 nS/pF × 0.2 mM/s). The resultant AP firing rate of the system is illustrated by various grey shades on the right; stripped areas indicate no firing; and mosaic areas indicate chaotic firing. B: Simulation traces for specific points of interest in panel A, illustrating more robust system operation when Ca2+ clock is functional. C: simulations of the effect of moderate PKA inhibition by 1.7 µM PKI (represented by vector bd in panel A). From (10).

