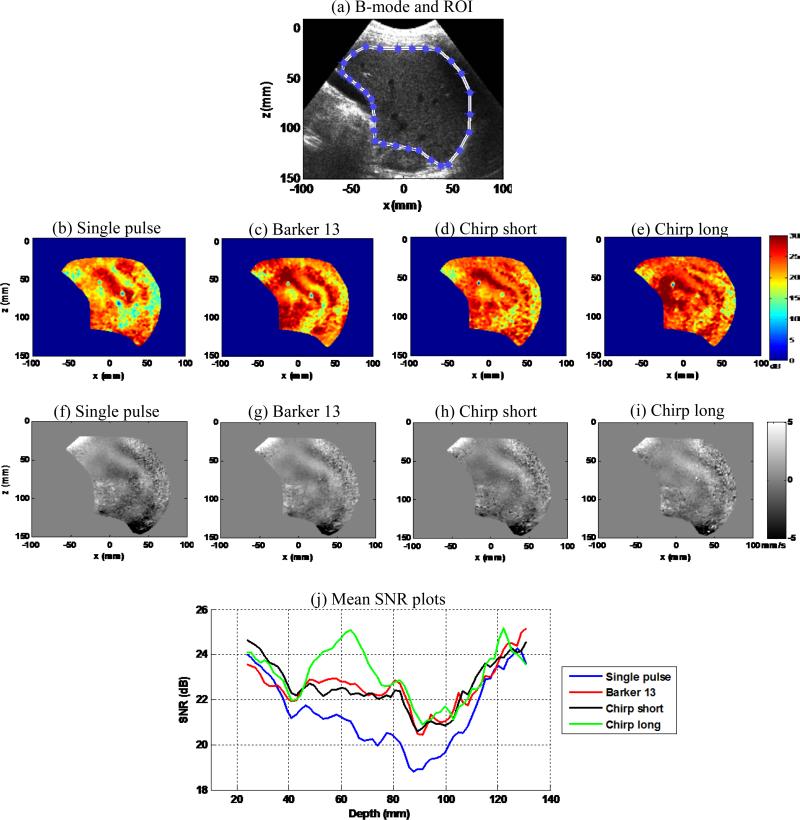
Figure 14.
(a) B-mode image of the liver and manually selected region-of-interest (ROI) for SNR calculation. (b)-(e) Shear wave SNR maps of the 4 detection pulses from one data acquisition. (f)-(i) Snapshots of the shear wave motion at the same time instant for the 4 detection pulses from one data acquisition. (j) SNR-depth plots of the 4 detection pulses. The SNR value for each pulse was averaged over the 5 independent data acquisitions.

