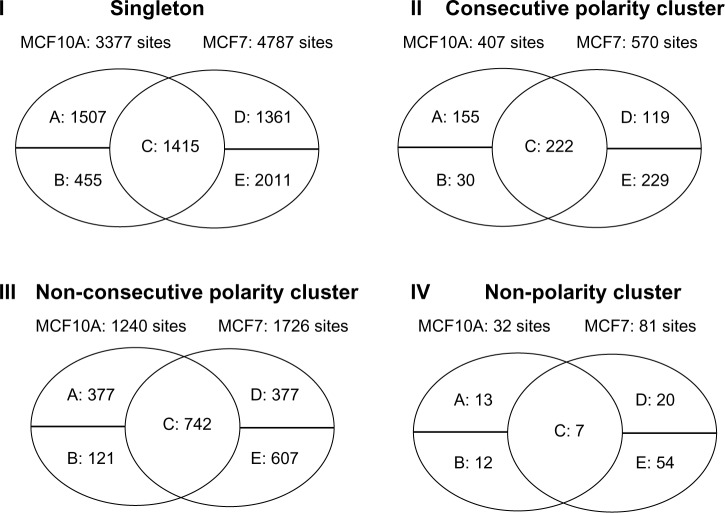
Figure 3.
MCF10A and MCF7 hemimethylation pattern comparison results. In each Venn diagram, the “A” entry means the number of CpG sites or clusters that are hemimethylated in the MCF10A sample, but not in the MCF7 sample. The “B” entry shows the number of CpG sites or clusters that are hemimethylated in the MCF10A sample, but there are no sequencing reads for these CpG sites in the MCF7 sample. The “C” entry represents the number of CpG sites or clusters that are hemimethylated in both MCF10A and MCF7. The “D” entry indicates the number of CpG sites or clusters that are hemimethylated in the MCF7 sample, but not in the MCF10A sample. The “E” entry means the number of CpG sites that are hemimethylated in the MCF7 sample, but there are no sequencing reads for these CpG sites in the MCF10A sample.

