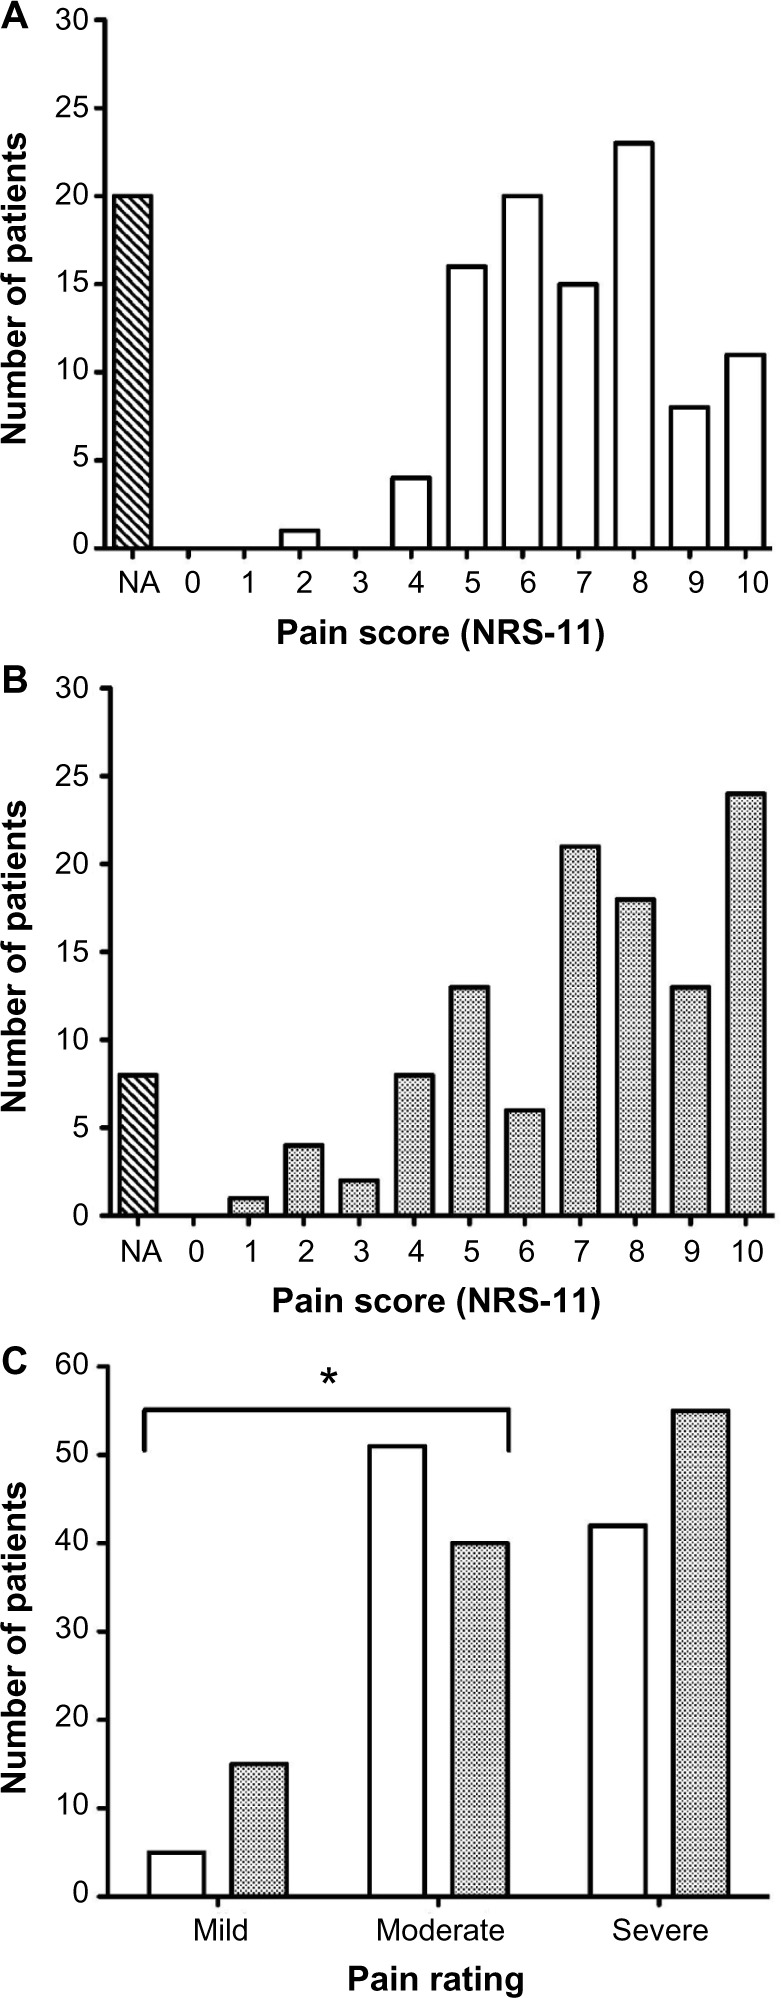
Figure 1.

Pain-intensity scores on admission and follow-up.
Notes: (A) Frequency distribution of pain-intensity scores on admission. (B) Frequency distribution of pain-intensity scores on follow-up. Pain intensities were assessed with an 11-point numeric rating scale (NRS-11). (C) Frequency distribution of categorized pain intensities. NRS scores were converted into severity categories, with NRS 1–4 representing mild, 5–7 moderate, and 8–10 severe pain. The proportion of patients with mild (P=0.031) and moderate (P=0.016) pain was significantly different on follow-up compared to admission (χ2 test). White bars, pain on admission; grey bars, pain on follow-up. *P<0.05
Abbreviation: NA, not applicable (no response recorded).
