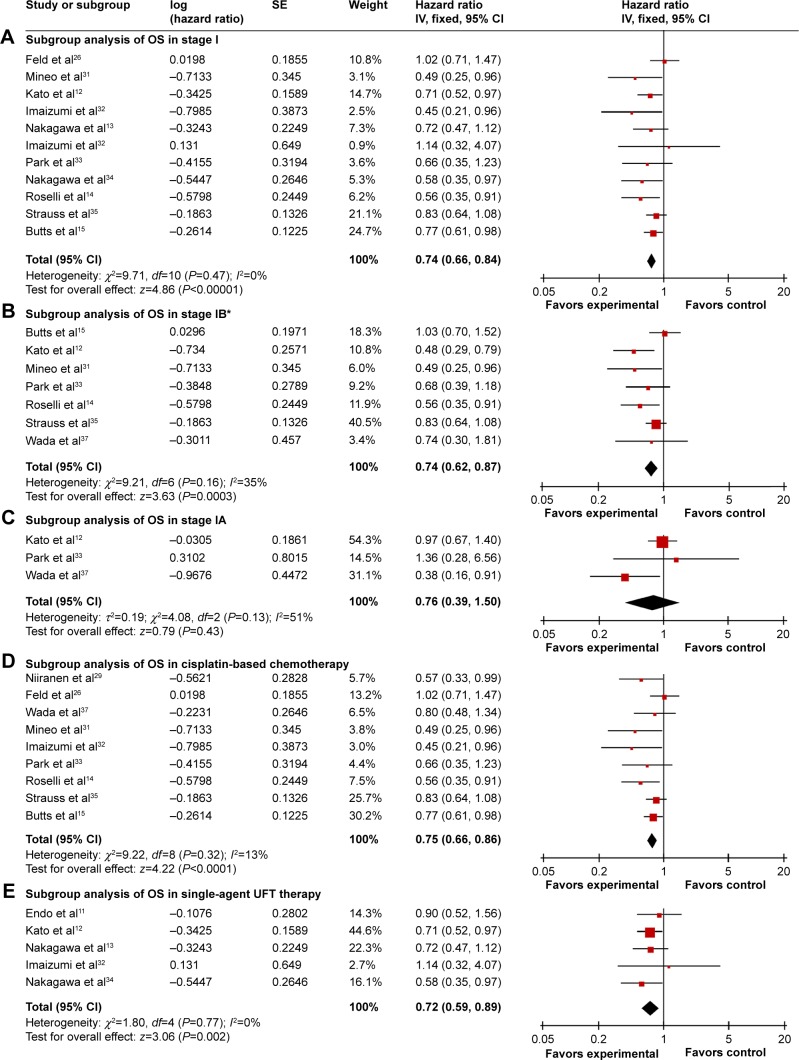
Figure 4.
Subgroup analysis of OS comparing chemotherapy and control groups.
Notes: (A) Subgroup analysis of OS in stage I. (C) Subgroup analysis of OS in stage IA. (B) Subgroup analysis of OS in stage IB. (D) Subgroup analysis of OS in cisplatin-based chemotherapy. (E) Subgroup analysis of OS in a single-agent UFT therapy. *Used random effect models.
Abbreviations: CI, confidence interval; IV, inverse variance; OS, overall survival; SE, standard error; UFT, tegafur–uracil.

