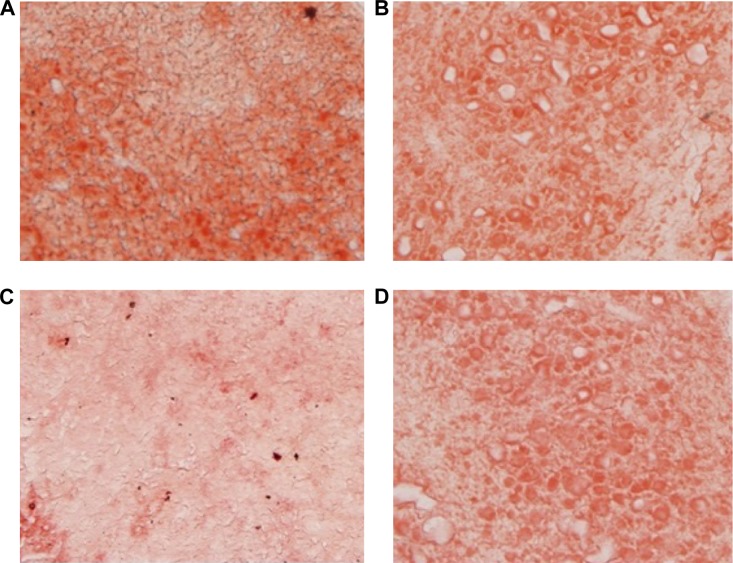
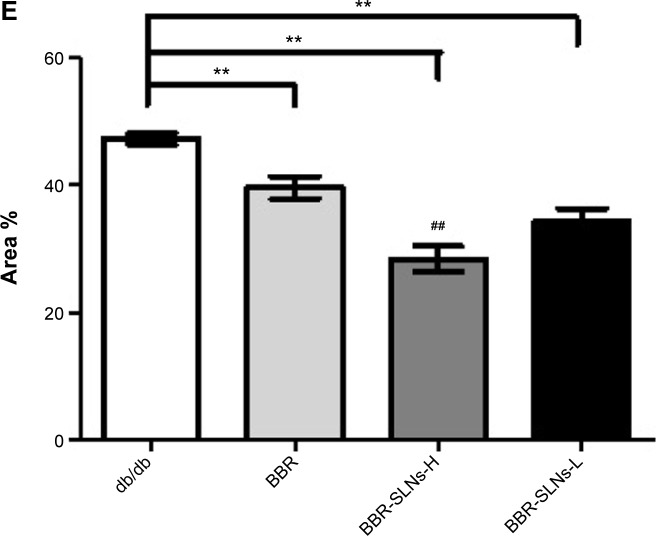
Figure 5.
Oil Red O staining in the liver.
Notes: (A) Control group (100×); (B) BBR (100 mg/kg) (100×); (C) BBR-SLNs (100 mg/kg) (100×); (D) BBR-SLNs (50 mg/kg) (100×); and (E) The red area coefficient with different groups. Oil Red O staining. **P<0.01 versus the control group; ##P<0.01 versus the BBR group.
Abbreviations: BBR, berberine; BBR-SLNs-H, berberine solid lipid nanoparticles high-dose group; BBR-SLNs-L, berberine solid lipid nanoparticles low-dose group; SLNs, solid lipid nanoparticles.


