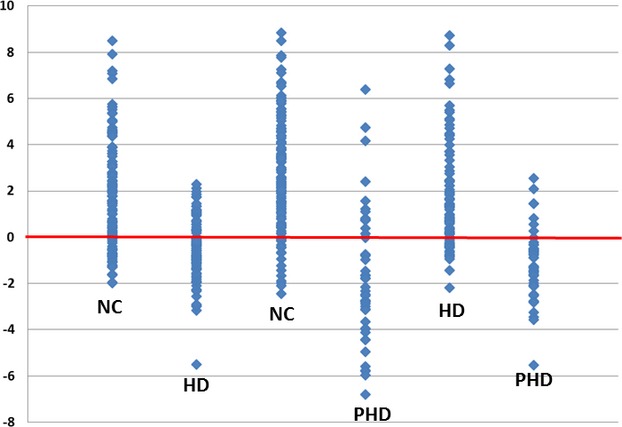
Figure 5.

Summation of one-out scoring. The graph is presented with 0.5 subtracted from all values to center around 0 and scaled by a factor of 100 for visualization. From the left, the first two columns score NC versus HD with NC as category A. The third and fourth columns score NC versus PHD with NC as category A. The fifth and sixth columns score HD versus PHD with HD as category A.
